
 1 Registry Star
Part:BBa_E1010:Experience
This experience page is provided so that any user may enter their experience using this part.
Please enter
how you used this part and how it worked out.
RFC25 compatible version of this BioBrick is available
The iGEM-Team iGEM14_LMU-Munich did two silent mutations to delete the two AgeI restriction sites within this BioBrick in order to gain a RFC25 compatible version of the BioBrick BBa_E1010. This new BioBrick is called BBa_K1351021
RANDOM SEQUENCE FOUND WITHIN PART
CGCTGATAGTGCTAGTGTAGATCGC is found after the RFP stop codon and before the BioBricks suffix. Should not affect transcription or translation of RFP, but good to keep note of it especially in analyzing sequencing results. (KP of siGEM)
- Please note that the above sequence is the old "barcode" sequence added to all of the original CDSs in the early BioBrick part collections. I.e., it's not a random sequence. See https://parts.igem.org/cgi/htdocs/barcodes.cgi for more information (D. Endy).
- FURTHER NOTE The Registry is not displaying barcodes on any of the original parts. The presented sequence information is wrong. This is a serious bug in the Registry that need to be fixed (D. Endy). Drew 14:34, 1 November 2010 (UTC)
Addition of His tag: Lethbridge 2019
For the purposes of our project we have added a his tag on the mRFP1 sequence for purification reasons. Although we have not been able to characterize just the His-mRFP1 construct this year ( composite parts BBa_K3237014 and BBa_K3237015), we have used this fused to pro insulin and SCI57 insulin variants in our project. Our purification data can be found on our website Lethbridge iGEM 2019 or on parts pages BBa_K3237016 and BBa_K3237018. These fusions were also designed for use in chlamydomonas reinhardtii . For more information see our parts BBa_K3237017 and BBa_K3237019.
Lethbridge_HS iGEM 2019
Our team utilized this part to characterize the therapeutic portion of our CRISPR Cas13a system. In brief, we designed CRISPR RNAs (crRNA) to target a portion of the GFP mRNA transcript that interact with four different Cas13a proteins from four organisms. We used RFP as a specificity control to ensure that our crRNAs would not cleave any RFP transcripts. In theory, we had hoped that all three plasmids (GFP or RFP, crRNA, and Cas13a) would be transformed into E. coli Rosetta(DE3) cells to determine if we could have specific targeting of GFP in vivo . While we were unable to get our triple plasmid transformation to work, we were able to add characterization data related to the growth and fluorescence of RFP in E. coli DH5α cells, and in a dual plasmid transformation into E. coli BL21(DE3) cells with RFP and the crRNA plasmid. We continued to work with RFP in the plasmid pSB1C3.
Initially, we worked on characterizing how RFP is able to grow independently. Our team wanted to create a standardized fluorescence curve for RFP as well as a standardized growth curve for the E. coli DH5α cells expressing it. Then, when it came time to conduct our in vivo fluorescence assay, these curves would prove to be useful references for comparison with our results. We pipetted biological replicates of RFP into a 96 well plate, then used a spectrophotometer to observe optical density over time, and also a spectrometer to observe fluorescence over time. Figure 1 showed what we had expected the growth to be with an increase in doubling time likely due to the load placed on the cell from expressing the plasmid. Figure 1 showed what we had expected the growth to be with an increase in doubling time likely due to the load placed on the cell based on the plasmid. However, further attempts at replicating this data have been unsuccessful (figure 2). We are uncertain as to the cause of this issue. We suspect that by using overnight cultures, the fluorescent protein may already be matured and thus we did not get reliable fluorescence data or the protein did not fold properly in vivo .
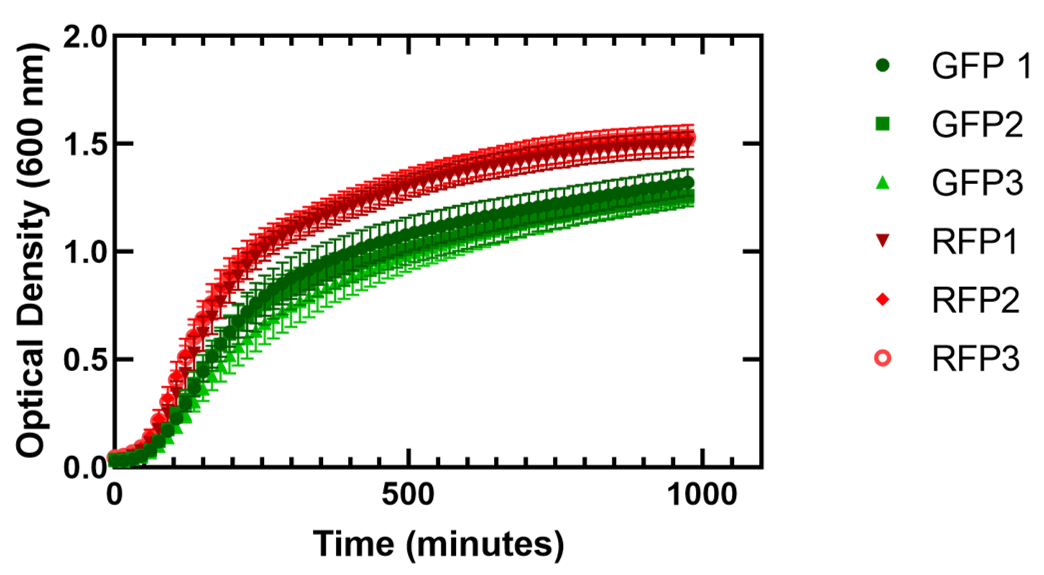 Figure 1. Growth of Escherichia coli DH5α cells containing GFP or RFP. 3 biological replicates for each fluorescent protein and 7 technical replicates were completed. Shown are all replicates averaged together and the standard deviation. The E. coli cells expressing GFP average doubling time varied from 38.2 +/- 0.9 minutes to 41.8 +/- 1.6 minutes and for cells expressing RFP the average doubling time varied from 37.8 +/- 0.2 minutes to 41.0 +/- 0.5 minutes.
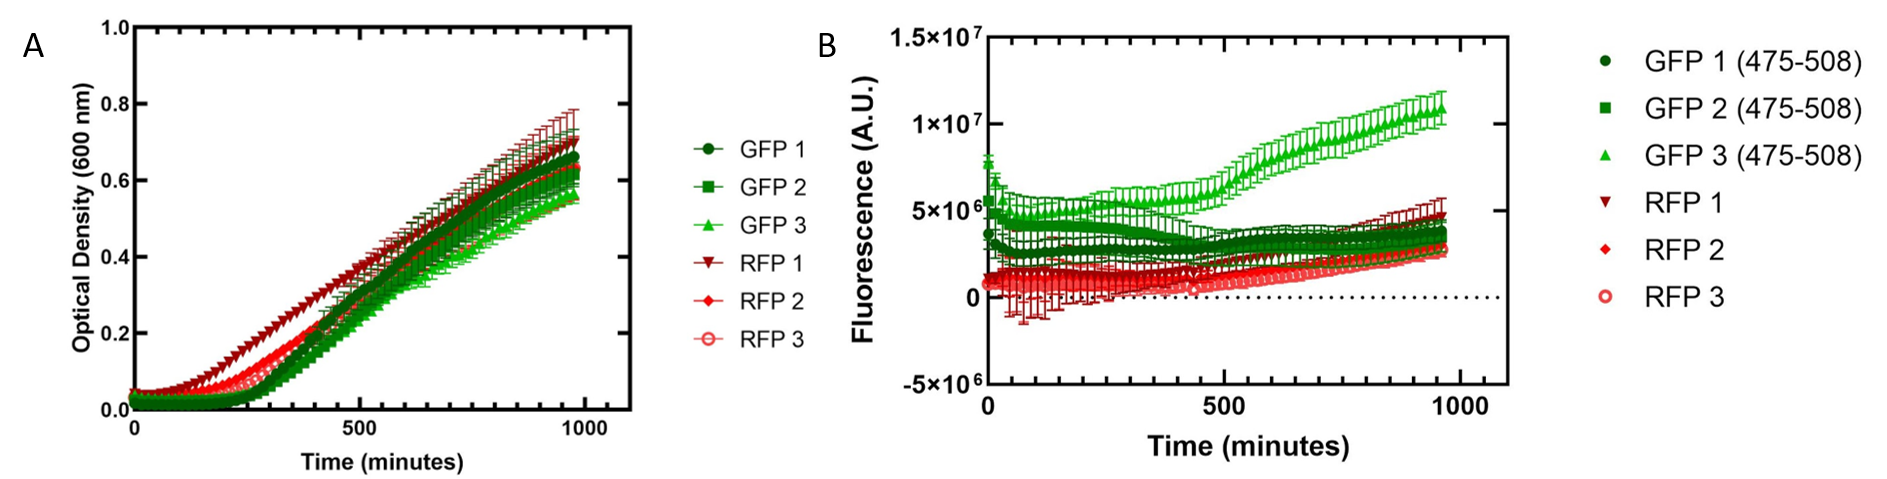 Figure 2. Growth of Escherichia coli DH5α cells containing GFP or RFP. 3 biological replicates for each fluorescent protein and 5 technical replicates were completed. Shown are the average technical replicates and the standard deviation. (A) Optical density of E. coli cells expressing GFP or RFP with absorbance measured at 600 nm. (B) Fluorescence of E. coli cells expressing GFP or RFP. GFP excitation was measured at 475 nm and emission at 508 nm. RFP excitation was measured at 558 nm and emission at 583 nm.
Figure 3 shows a co-culture assay with a 1:1 ratio of GFP and RFP expressed in E. coli . We wanted to see if one culture of fluorescent protein would outcompete the other present. As with the single cultures shown in figure 2, the cells replicated slowly. Our fluorescence data indicated that the GFP we are using is more fluorescent than RFP. The fluorescence of RFP also showed greater variation, indicating that the RFP may not be folding properly to be excited in all replicates.
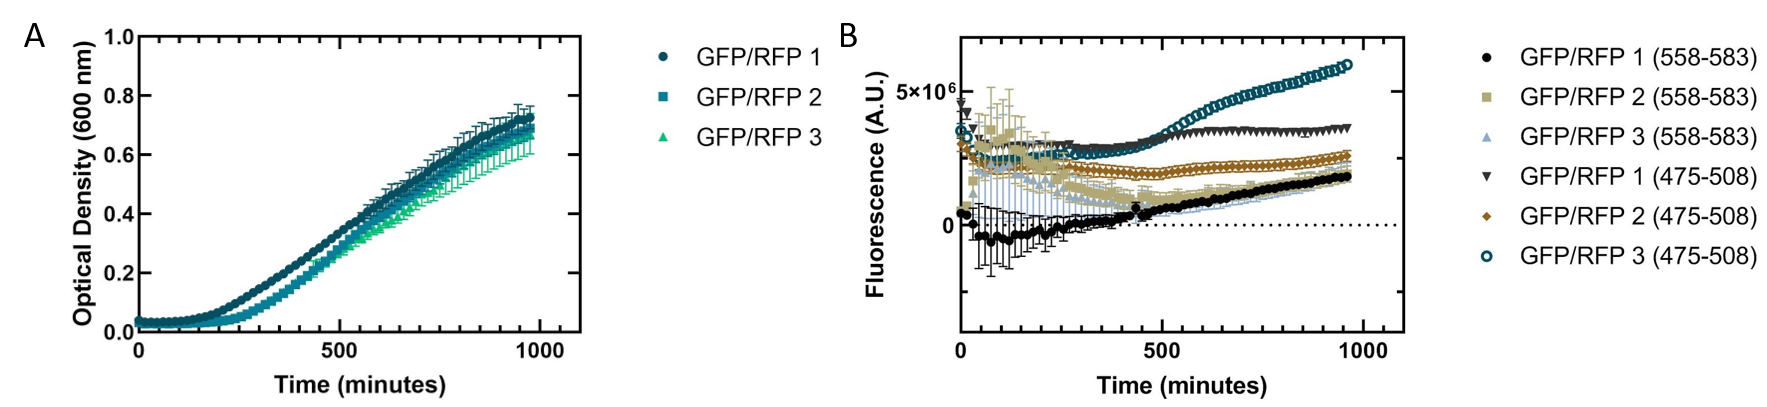 Figure 3. Co-culture of Escherichia coli DH5α cells containing GFP or RFP. Equal amounts of each cell type were added into a 96 well plate and grown together to see how they would grow in tandem. 3 biological replicates for each fluorescent protein and 6 technical replicates were completed. Shown are all replicates averaged together and the standard deviation. (A) Optical density of E. coli cells expressing GFP or RFP with absorbance measured at 600 nm. (B) Fluorescence of E. coli cells expressing GFP or RFP. GFP excitation was measured at 475 nm and emission at 508 nm. RFP excitation was measured at 558 nm and emission at 583 nm.
We completed a dual plasmid transformation. To confirm that we had both plasmids present we completed a digest test because PCR amplification from the colony was not working. This should separate our construct from the plasmid confirming that both parts are present. In figure 4, only linearized cuts are seen. Due to both plasmids being approximately the same size it is difficult to see. However, there are two bands present.
Initially, our team had planned on doing a triple plasmid transformation of our target fluorescent protein (GFP), crRNA, and Cas13a to test if our system would work in vivo . Additionally, we wanted to have RFP as the fluorescent protein to serve as a specificity control instead of transforming the plasmid containing GFP. We were unsuccessful in getting all three plasmids to transform, but did succeed in getting the fluorescent proteins and crRNA containing plasmids to transform together as seen in figure 4.
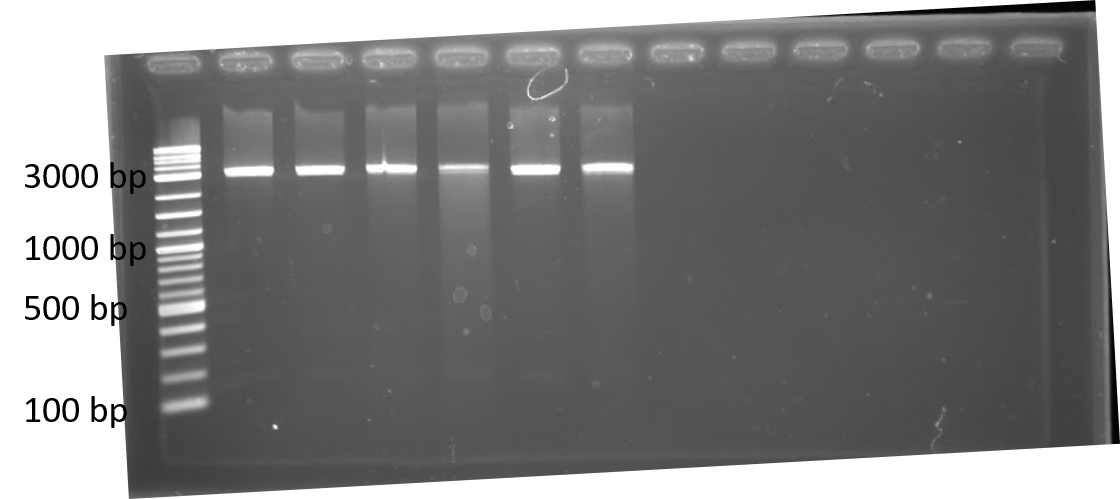 Figure 4. 1% agarose of restriction digests using PstI and EcoRI from Escherichia coli BL21(DE3) cells containing plasmids for RFP and either Lbu crRNA or Lwa crRNA. Left to right: lane 1: 1 kb ladder; lane 2: Lwa crRNA colony 1; lane 3: Lwa crRNA colony 2; lane 4: Lwa crRNA colony 3; lane 5: Lbu crRNA colony 1; lane 6: Lbu crRNA colony 2; lane 7: Lbu crRNA colony 3; lanes 8-13: empty.
As an alternative experiment, our team grew cells that expressed the Lbu and Lwa Cas13a protein overnight. We also grew cells that expressed dual plasmids; GFP and crRNA Lwa; GFP and crRNA Lbu; RFP and crRNA Lwa; and RFP and crRNA Lbu. We then lysed the cells that expressed the Cas13a proteins using a French Press and clarified the lysate via centrifugation. Following this, our team pipetted in a 1:1 ratio of clarified cell lysate: fluorescent protein and crRNA into a 96 well plate. This allowed us to observe if there would be an effect from the CRISPR Cas13a system on the fluorescent proteins. We observed that in our optical density data, both dual plasmid systems for GFP and RFP had stunted growth in comparison to only E. coli cells expressing GFP or RFP or no plasmid (Figure 5C). Adding the lysate may have caused the death of the culture. We neglected to include replicates of the dual plasmid system without adding lysate to observe how that grew. This would be beneficial for any future experiments. Alternatively, there may have been some effect of the protein in the lysate on the GFP fluorescence (Figure 5B). However, we are unsure of the specificity due to the potential of the RFP not folding correctly in vivo as demonstrated by the substantial standard deviation seen in our replicates (Figure 5A).
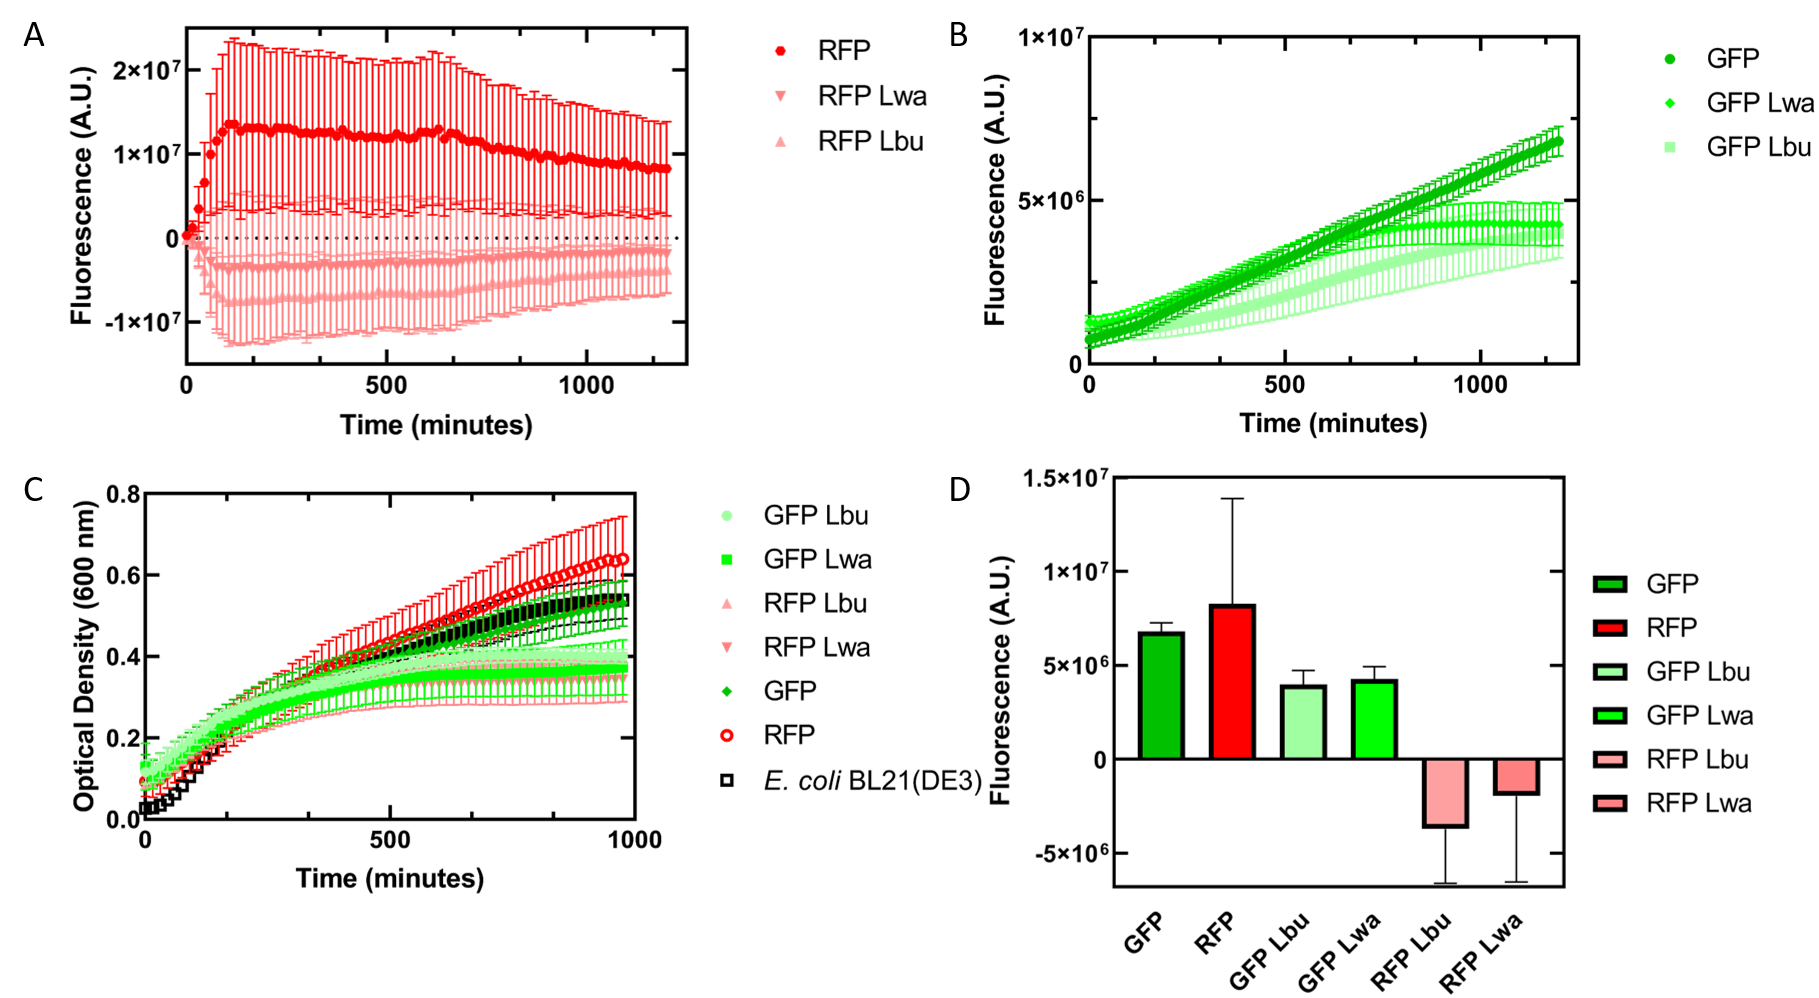 Figure 5 In vivo fluorescence assay of E. coli BL21(DE3) cells containing fluorescent protein and crRNA plasmids and E. coli Rosetta(DE3) cell lysate of overexpressed Cas13a proteins. This assay was conducted with 3 biological replicates and 3 technical replicates. (A) Fluorescence of E. coli cells containing only an RFP expressing plasmid, or dual plasmid expression of RFP and crRNAs from Lwa and Lbu that target GFP and the respective cell lysate containing the appropriate Cas13a. RFP excitation was at 558 nm and emission at 583 nm. (B) Fluorescence of E. coli cells containing only a GFP expressing plasmid, or dual plasmid expression of GFP and crRNAs from Lwa and Lbu that target GFP and the respective cell lysate containing the appropriate Cas13a. GFP excitation was at 475 nm and emission at 508 nm. (C) Optical density of E. coli cells expressing GFP, RFP, dual plasmid systems mentioned previously, or only E. coli BL21(DE3) cells with absorbance measured at 600 nm. (D) Relative fluorescence at maximum excitation at 81 minutes. GFP excitation was at 475 nm and emission at 508 nm and RFP excitation was at 558 nm and emission at 583 nm.
Applications of BBa_E1010
iGEM14_Carnegie_Mellon. We characterized a set of fluorescent proteins consisting of BFP. GFP, YFP, OFP, and RFP. We calculated the signal-to-noise ratio of all the proteins in two different cell lines (MACH and Top10). RFP had a high signal-to-noise ratio in both cell lines. RFP was measured at (ex/em = 584nm/607nm).


User Reviews
UNIQ97d0a0a8f4ca58c1-partinfo-00000000-QINU
|
••••
iGEM Kyoto 2018 |
Characterization of RFP BBa_E1010 |


|
•••••
Hong Kong-CUHK iGEM 2017 |
Charaterization of mRFP pH stabillity We grew C41 bacteria with parts BBa_J61002 in 2XYT for 24 hours. Purifying the mRFP by Ion Exchange Chromatography and Hydrophobic Interaction Chromatography, we measured the fluoresece (ex ,em ) of purified mRFP. which is diluted to 10µg/100µl (total 200µl) in triplicates, into different buffers (ranges from pH2 to pH12). The result shows that the stability drops dramatically in pH condition below 6 and relatively stable in pH 6-10.
|

|
•••••
Immudzen |
As part of the 2013 CU Boulder project we worked on separating RFP from AmilCP and during that process we ran into a problem that the fluorescence of RFP is too close to the absorption of AmilCP to tell them apart. What we ended up doing was measuring the spectrum of RFP from 400nm to 600nm.
What we found is that RFP has a secondary absorbance peak at 502nm which is well clear of AmilCP. Under the devices we had access to this secondary peak also remained in the linear region of our device over a much wider concentration range. We also found that when running on an agarose gel RFP will run down on the gel while AmilCP runs up on the gel. |

|
•••••
HIT-Harbin |
1)Measuring absorbance of RFP
We grew bacteria without device(BBa_J04450) and bacteria with parts BBa_J04450 in same volume until stationary phase. Taking bacteria without device as background, we measured the absorbance of bacteria with our device (the max absorption peak is 504nm).But absorbance in 504nm is higher than 1,which present a bad linear relation between absorbance and concentraton. RFP has absorption in 450nm,and absorbance is between 0.1 and 1(better linear relation).Occasionally, we find a RFP standard curve under 450nm on the web.Before the mensuration, we diluted the two groups according to table1. We took the mean of two measures as the useful data. " Fig.1 RFP absorbance varying with wave length Table 1 Dilution of Two groups of bacteria " Fig 2. The relationship between RFP concentration and absorbance(OD450) 2)The actual relationship between RFP concentration and absorbance " Fig 3. RFP standard curve obtain from the web absolute concentration, and finally get the relationship between IPTG concentration and RFP concentration. Compared to crushing cells to separate RFP, our method is simpler and easy topractice. Moreover, our relative concentration curve is credible. If the standard curve is reliable, our calculated result of RFP will be precise. |
 "
"
 "
"
"
" "
"
 "
"
|
•••••
Carnegie_Mellon 2013 |
Characterization of the Photostability of mRFP1 XL10 Ultracompetent cells were transformed with BBa_E1010 cloned with BBa_B0034 as the RBS and BBa_R0010 as the wild-type lac promoter and induced overnight with IPTG.The overnight was bleached for 180 minutes with HBO100 (100W Mercury-arc lamp). Fluorescence data was taken using a Tecan Safire II with the parameters shown in Table 3. Fluorescence values are shown in Table 4.
|

|
••••
KAIST_iGEM_2012 |
 Figure 1. E.coli strain MG1655 expressing BBa_E1010 under control of BBa_K907005 after overnight culture. 3mL culture with M9 media in 14ml round bottom tube(left), and centrifuged cells in eppendorf tube(right). The expression of BBa_1010 is clearly observed with naked eye after overnight culture.
|
|
•••
DTU_igem_2010 |
Characterization of RFP BBa_E1010 Method Results
|


|
Antiquity |
This review comes from the old result system and indicates that this part did not work in some test. |
|
Nkessler |
We successfully used this part for a read out system, e.g. in BBa_K389016. Additionally we compared it with a luciferase: BBa_K389004. |